How to measure ASO results in the App Store and Google Play
It is not enough to evaluate the effectiveness of ASO according to app positions in search. To draw valid conclusions and set the right goals, you need to analyze other important App Store Optimization metrics. In this article, we will tell you which KPIs to pay attention to when measuring the impact of ASO, as well as discuss the mistakes that beginners make when analyzing app performance.
This is a series of articles based on Asodesk Academy materials, where we cover all aspects of ASO. We have already explained how to start working on ASO, compiled a checklist for ASO in the App Store and Google Play, as well as listed 13 rules for working with metadata.
Contents
How to evaluate the visibility of an app in the App Store and Google Play
How to estimate conversion rates in the App Store and Google Play
Top mistakes when measuring the impact of ASO
What should be included in the ASO performance report
ASO fulfills two main goals: improving app visibility in the App Store and Google Play search, as well as increasing your conversion rate. Read more on how to achieve these goals in this article.
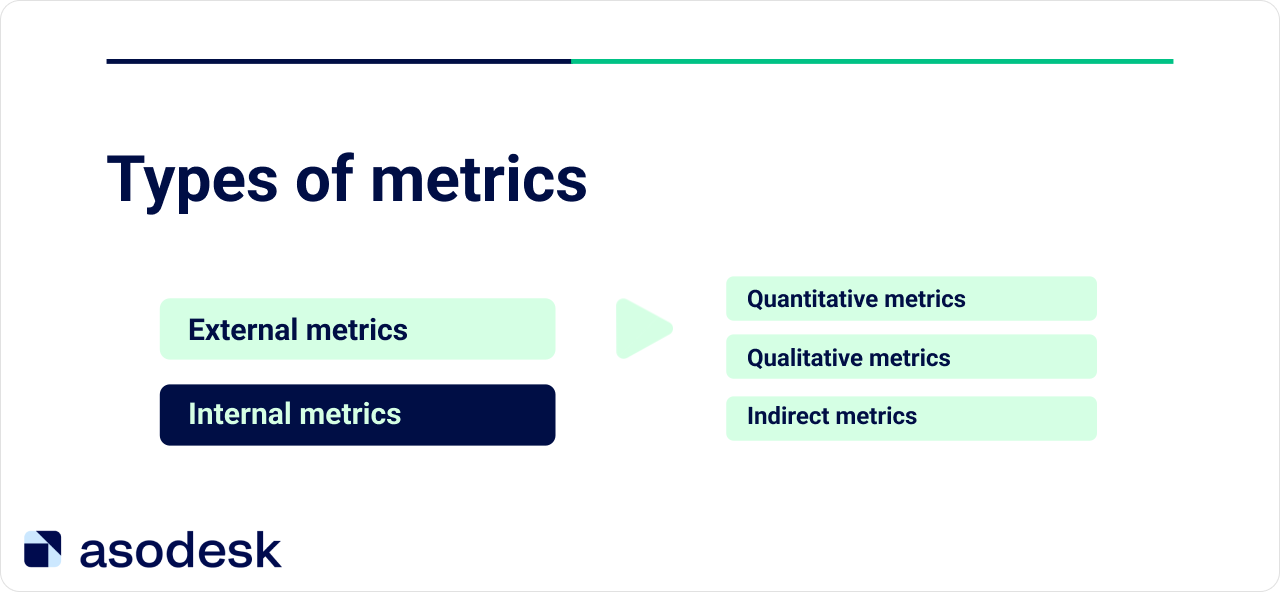
The visibility of an application in search can be assessed using external ASO metrics. Internal metrics indicate the number of installs and conversion from the app page.
How to evaluate the visibility of an app in the App Store and Google Play
The visibility of an app in the App Store and Google Play depends on keyword rankings for the required queries, as well as their popularity. The growth of app positions for popular queries at the top of the stores indicates the effectiveness of an ASO specialist’s work.
It is important to evaluate app visibility in search using both quantitative and qualitative metrics.
Quantitative metrics
We need to establish for how many queries we are in the top 5, 2–5, 6–10, as well as in lower positions. An app in the top 5 can get good visibility, and an app in the top 5–20 has good visibility potential.
You can use Asodesk’s ASO Comparative Report to check visibility for queries. It allows you to see the dynamics by day and estimate how much the app’s position has worsened or improved over the selected period. Queries are broken down by the places they occupy in search.
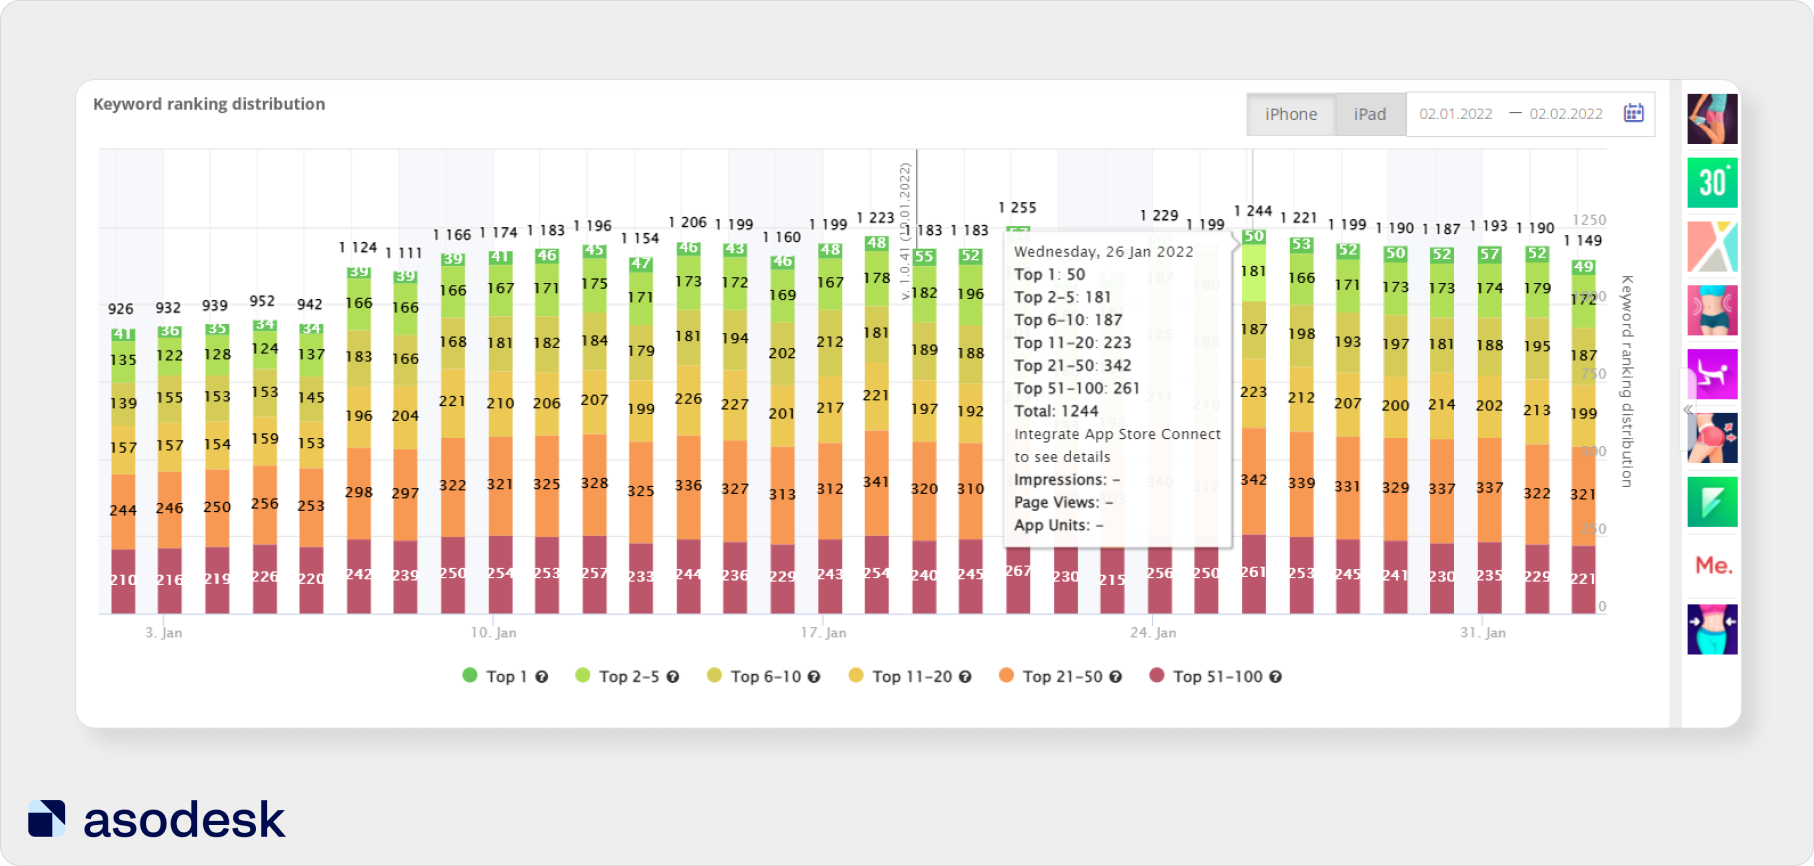
When integrating this tool with App Store Connect and Google Play Console, you will also see Impressions (the number of times your app has been shown in search), Product Page Views (number of page views of your app), and App Units (number of app installs).
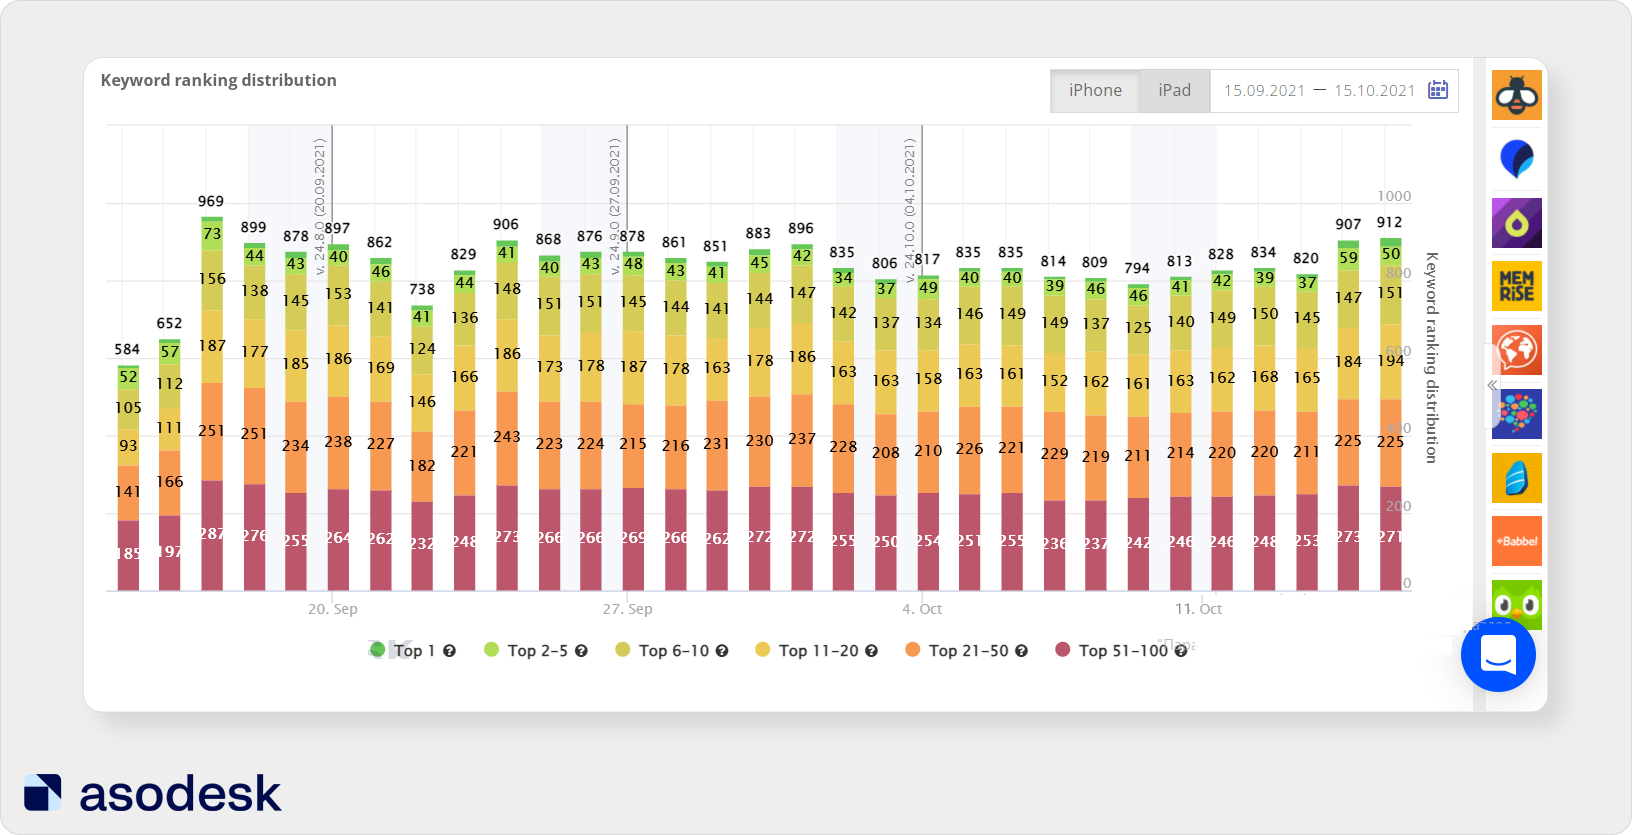
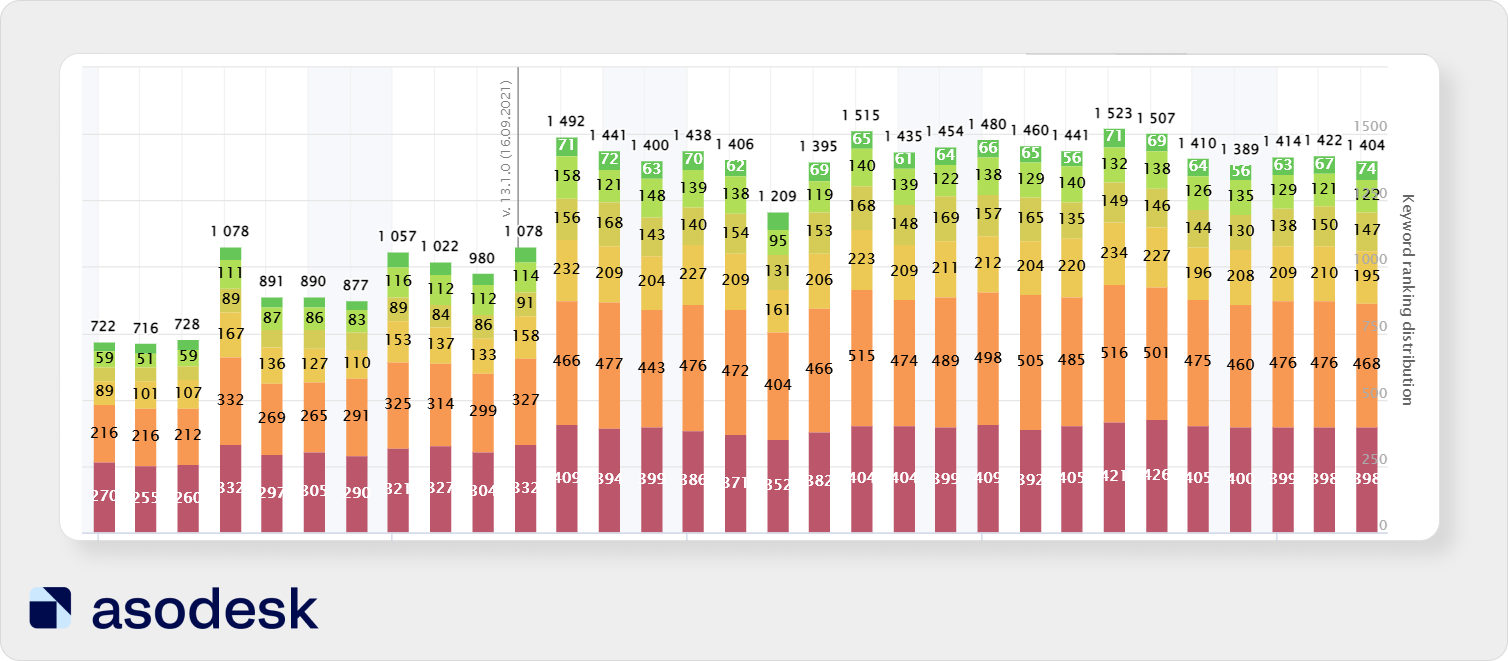
You can click on the desired group of keys to check the statistics for that group only. For example, look at the queries for which you ranked in the top 1. On the graph, the horizontal line and a number indicate the date of the update.
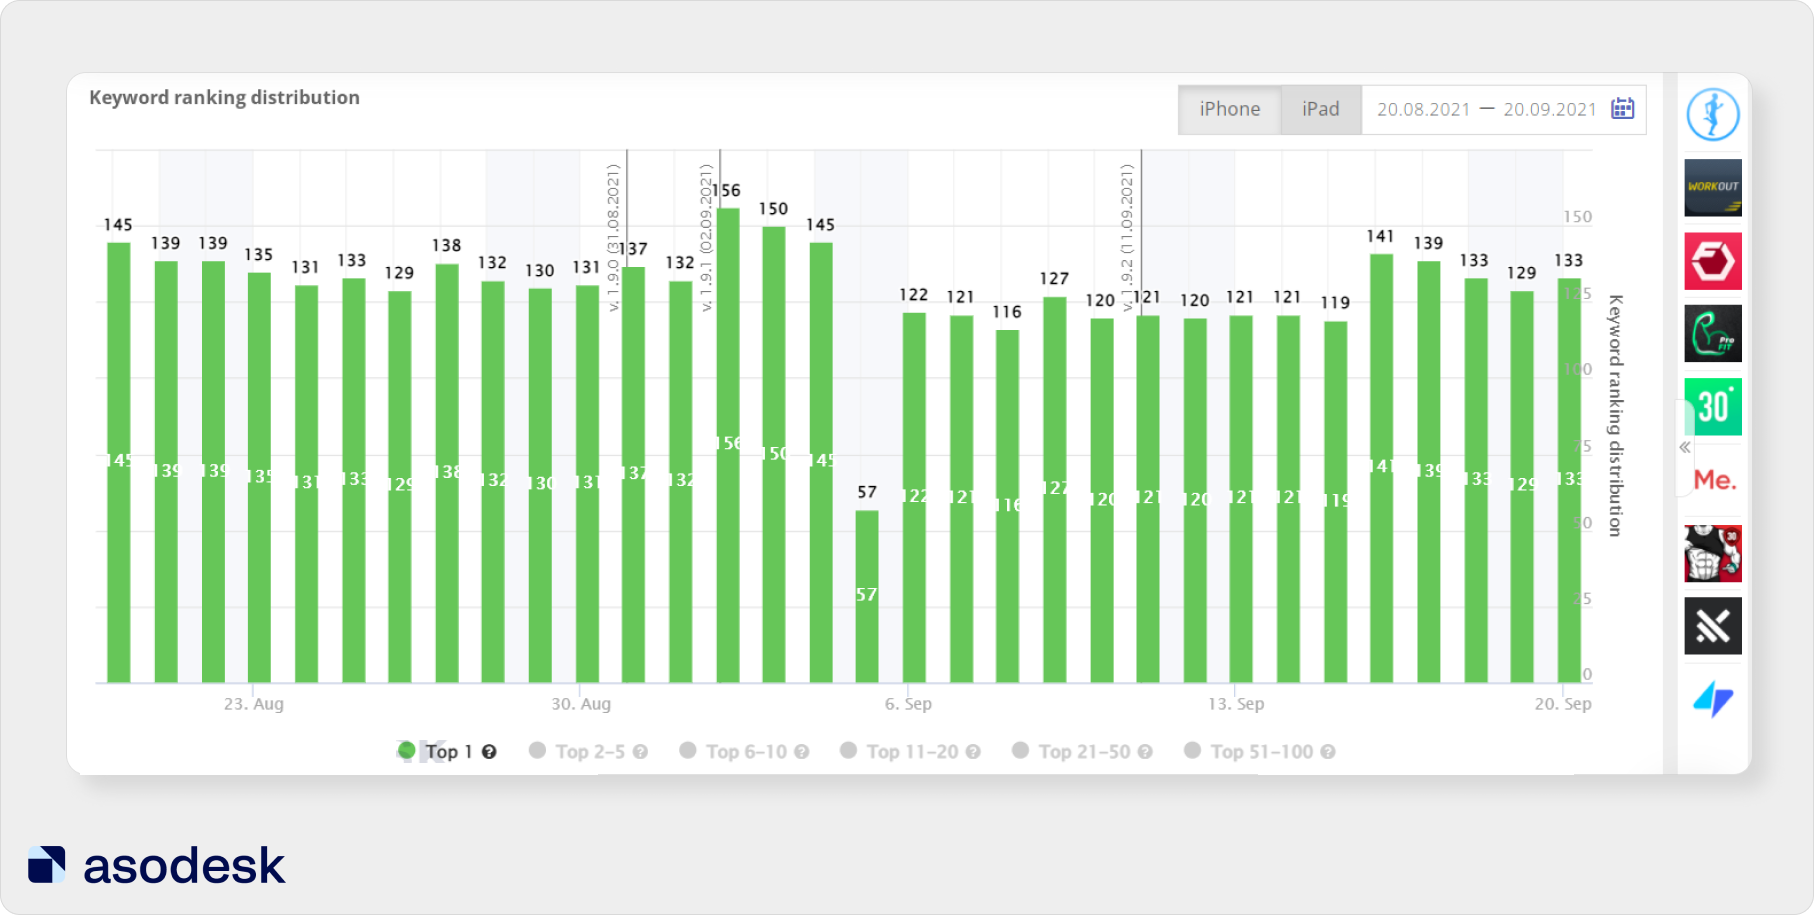
It is also important to remember that in the first few days after the update, app positions in the App Store and Google Play may fluctuate.
In the graph above, after the update on September 2, we see a sharp increase in the number of queries for which the app is ranked in first place. Then there is a steep decline — the app loses its position in the top 1 for almost 100 queries. After that, the positions stabilize and the app starts ranking in first place for about 100 queries.
Try ASO Comparative Report for your apps.
However, when evaluating the effectiveness of ASO, it is not enough to rely only on app positions for two reasons:
1. With this kind of analysis, the structure of search queries — their relevance to your app and frequency — is not obvious. An app might rank high for an unpopular query that is rarely used and can’t bring you traffic.
2. Apps below position 8 will receive little traffic. But there are exceptions. For example, parents can download apps further than 8 positions to choose the most educational game for their children.
Looking only at app positions when evaluating the effectiveness of promotion is a big mistake. You need to evaluate the actual visibility of your application; your installs depend on it. This visibility will also be influenced by qualitative metrics.
Qualitative metrics
Distribution <popularity — app position>
To evaluate the real app visibility for queries, you need to look at their popularity. To evaluate popularity, Asodesk uses Daily Impressions — an algorithm that shows the number of impressions per query per day.
You can evaluate the distribution of search queries using Semantic Chart in ASO Comparative Report. The queries are shown vertically from less popular to more popular. App positions are shown horizontally from low to high.
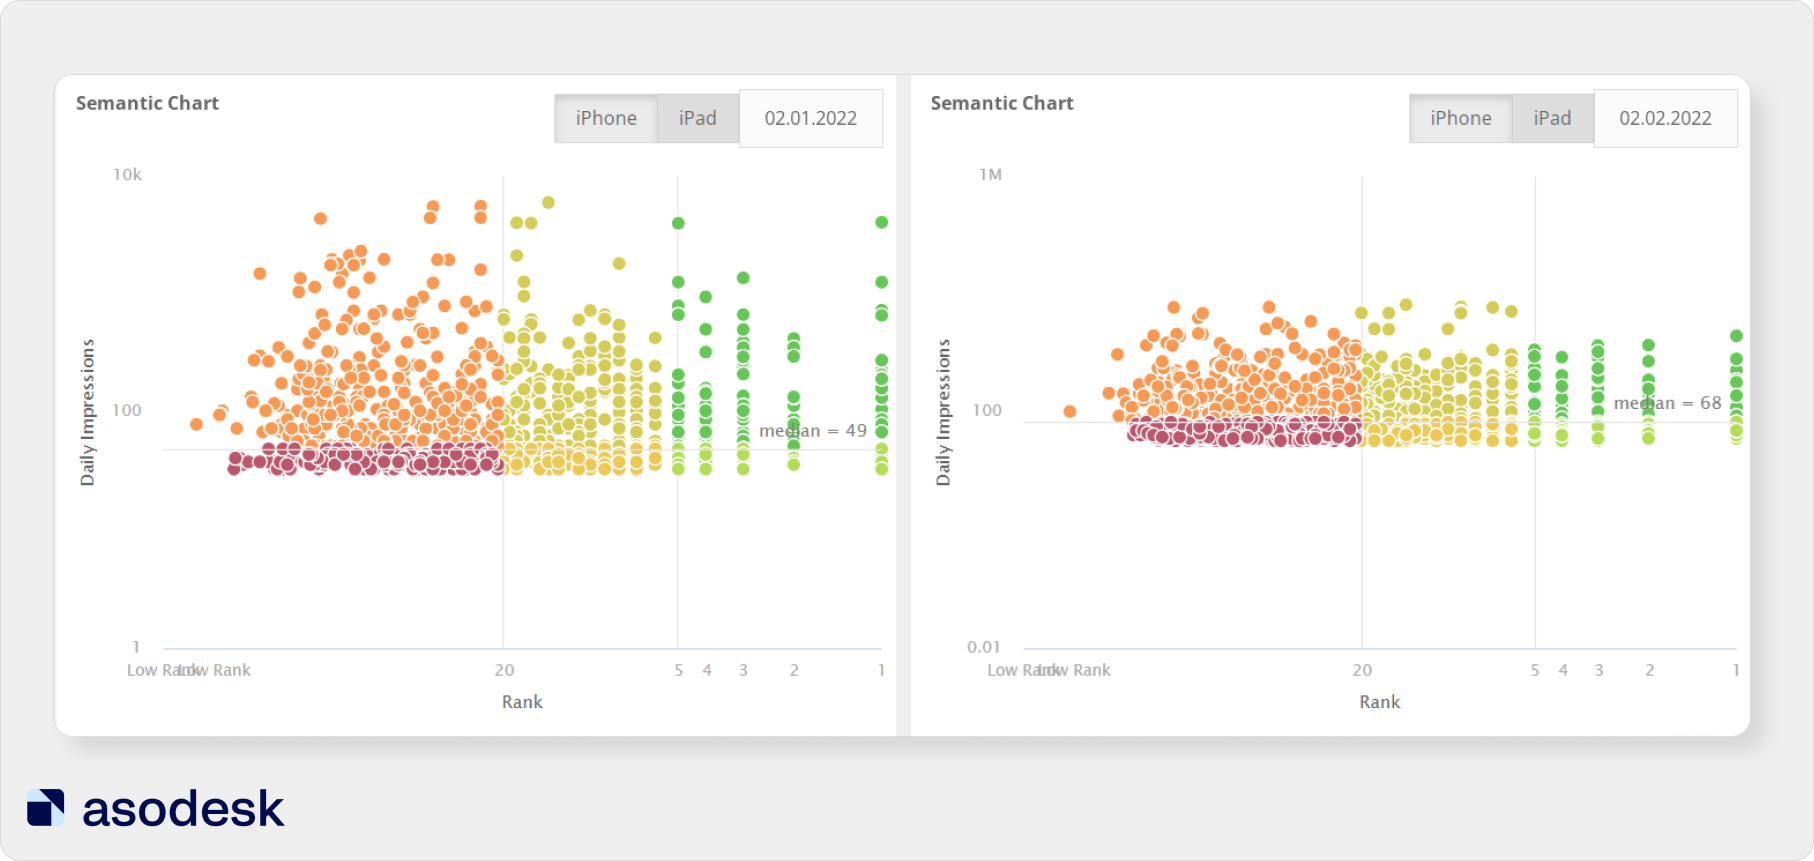
Semantic Chart helps you track popular queries which are in the visible zone for users. With the help of this graph, you can also compare the popularity of queries and positions for them for two dates. For example, in the graph above, we can see that a large number of popular queries were lost in January.
Indirect metrics
App featuring
The ability to get featured is affected by app quality, update frequency, page design, localization, and app rating.
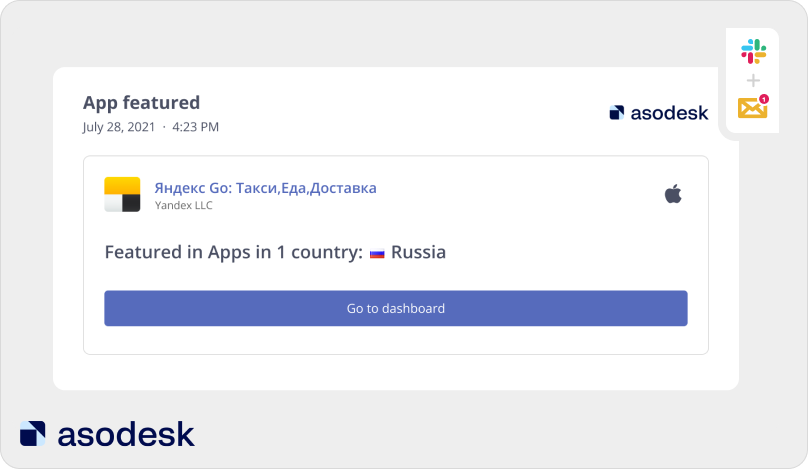
If you are aiming to get featured, you need to periodically check information about getting featured. This data is displayed in the general app report from Asodesk (App Overview). You can receive this report by email or Slack for any desired period.
Instant notifications about featuring are also available. The notification will tell you on which day and in which country the app was featured.
Learn more about how to set up custom reports and notifications in Asodesk.
App positions in categories and top charts
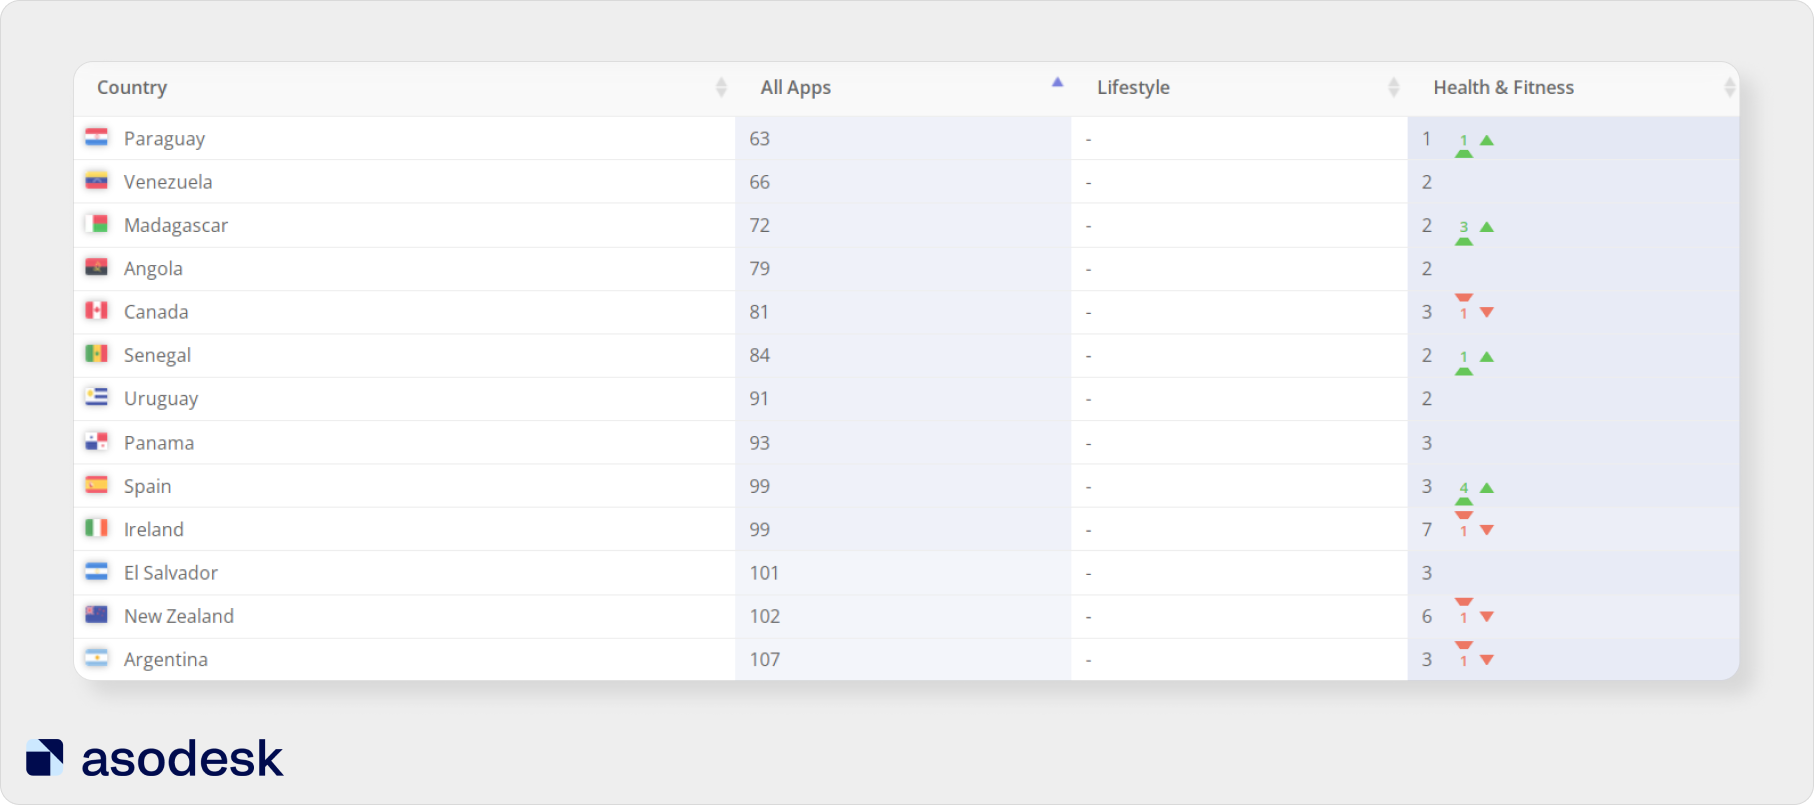
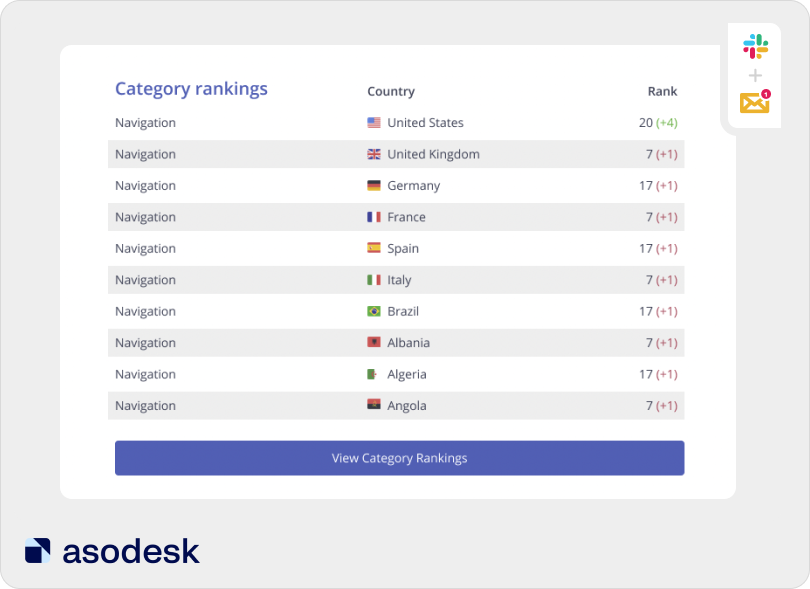
Category Ranking at Asodesk will show app positions in the top charts (All Apps) and categories.
Start using Category Rankings for your apps.
What’s more, when using Asodesk, you can set up automatic reports that will show your positions in categories for the selected period.
Read how to customize this report for your apps.
It is important to understand that getting an app into categories and top charts is the result of an effective promotion strategy. First, the app reaches a large number of installs, and only then can it claim a position in the top charts.
Also, getting into categories and top charts does not always bring a large volume of installs. For example, in the App Store, only certain app categories get over 20% of their traffic from Browse. You can find out the amount of organic traffic for different app and game categories in this Asodesk research article.
Getting into the top charts is not the goal of an ASO specialist. You can monitor this indicator additionally, but the main metric is the installs that you will receive thanks to high positions for popular search queries.
How to estimate conversion rates in the App Store and Google Play
An ASO specialist should not only make an app visible to users but also convert app page views into installs. While text optimization affects app visibility in search, app install conversion is also affected by visual metadata. In this article, we explained how to prepare screenshots and videos for your app.
An important aspect of measuring the effectiveness of ASO is the analysis of internal metrics: the number of installs, app page views, and conversion rate. Internal metrics directly affect app revenue, so an ASO specialist needs to take them into account.
Estimate the number of installs and conversion rate from the app page
When analyzing the effectiveness of promotion, it is important to pay attention to the following internal app marketing metrics:
- Impressions (the number of times the app name was viewed in App Store search for more than 1 second);
- Product Page Views (app page views in the App Store);
- App Installs (registered when the app is opened for the first time);
- App Units (registered when clicking on the “install” button);
- Conversion Rate Benchmark.
Google Play Analytics only counts initial app installs.
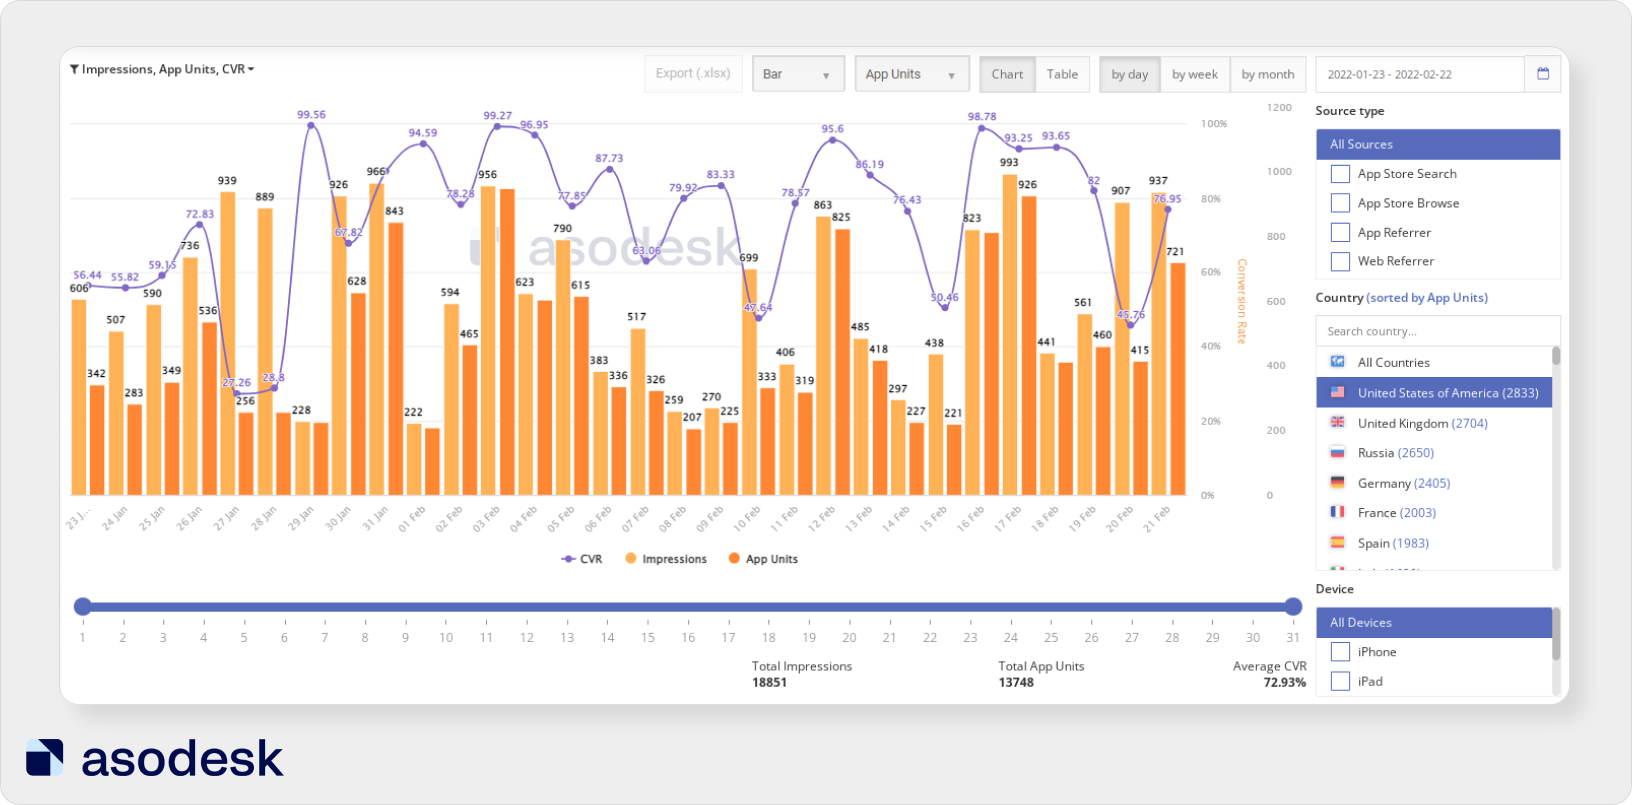
In Asodesk, you can evaluate these metrics for the required sources. ASO Dashboard will show the number of organic app installs in the App Store and Google Play (from Search and Browse), as well as from App and Web Refer. As a rule, installs from App and Web Refer come from ads. You can view the evaluation of this data for any period for any country.
Get free trial access to ASO Dashboard and other Asodesk professional tools for 7 days. You will get full access after you register.
An ASO specialist should assess how install numbers and conversion change after optimization. These indicators should be analyzed simultaneously with positions at the top of the stores.
We often see that as Impressions increase, conversion falls, but installs remain at the same level. This means that we did not get a positive result from the optimization. Sometimes Impressions drop, conversion does not increase, but App Units grow. This means that we need to see which keys from this update brought us results.
It is important to evaluate the effectiveness of iterations as a whole: analyze app visibility, as well as installs and conversion.
Comparing the conversion rate to the market average
Some categories on the App Store and Google Play have a lower conversion rate, others have a higher conversion rate. For example, on average, the conversion in the App Store category “Entertainment” is quite low — about 5%. Whereas in the “Sports” category, the conversion can reach 69%.
Therefore, it is important to compare the conversion rate for your app with the market average. To do this, you can use Asodesk’s free CVR Benchmark tool. With this tool, you can see the conversion rate from Impressions and Product Page Views in the App Store. You can check this indicator for four sources: App Store Search, App Store Browse, App Referrer, Web Referrer.
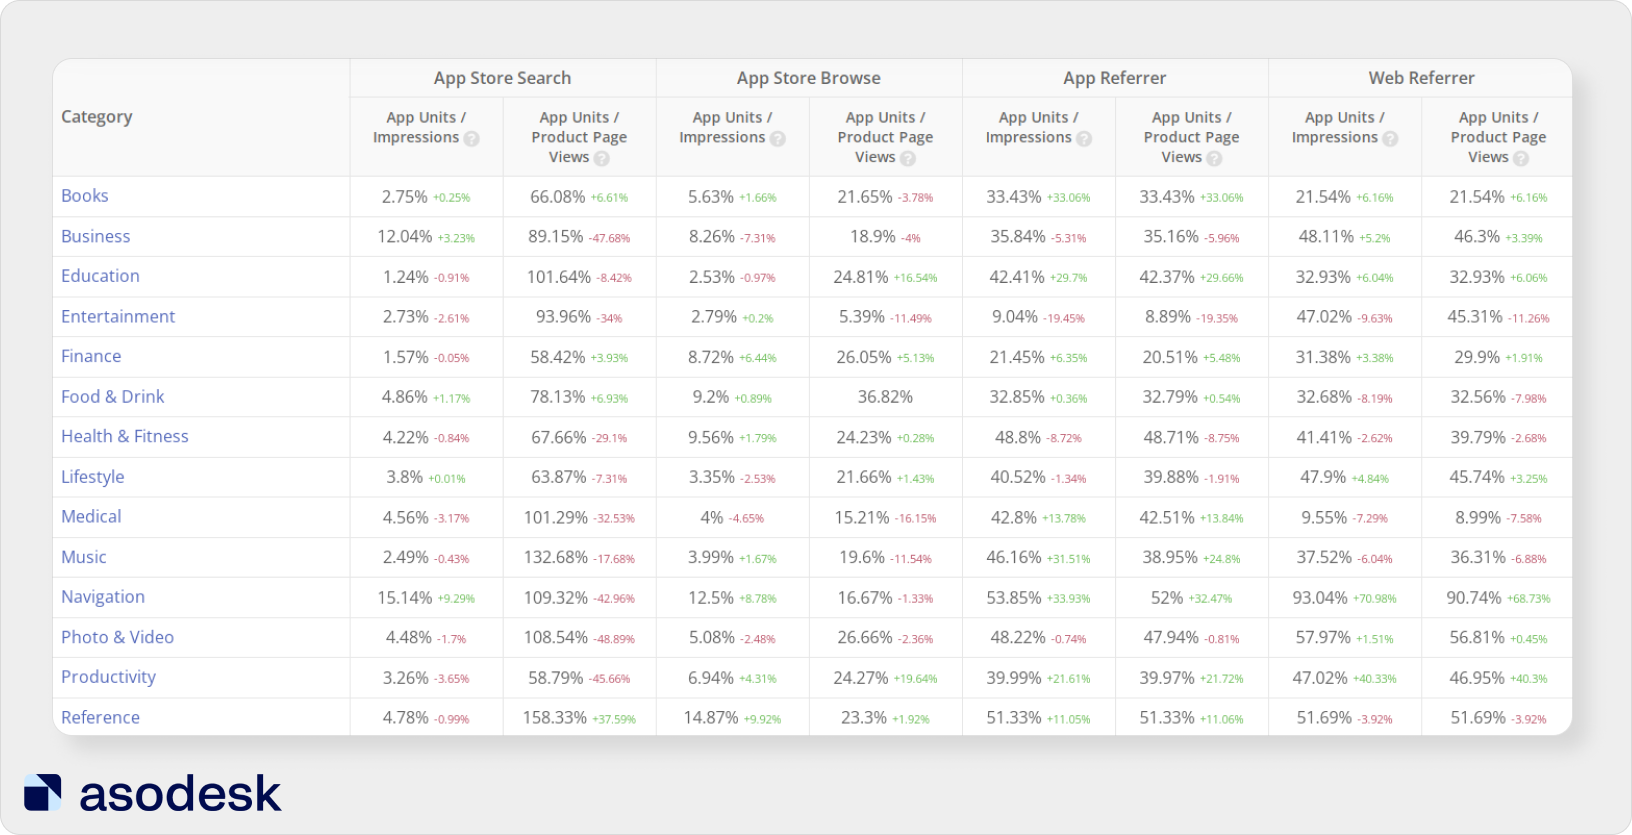
Try CVR Benchmark for your apps for free.
Top mistakes when measuring the impact of ASO
1. Evaluating the distribution of positions without an integrated approach
It is important to evaluate both rises and drops in positions thoroughly. Only an integrated approach will help you understand how and why app positions have changed.
For example, on the chart, we see an increase in positions for queries between two dates: September 15 and October 15.
We can see that we received 37 new positions for queries in the top 6–10.
But not everything is so straightforward; we also dropped out of the search for 44 queries and fell lower for 26 queries. The app has lost positions for its popular and important queries “learn spanish” and “language learning”.
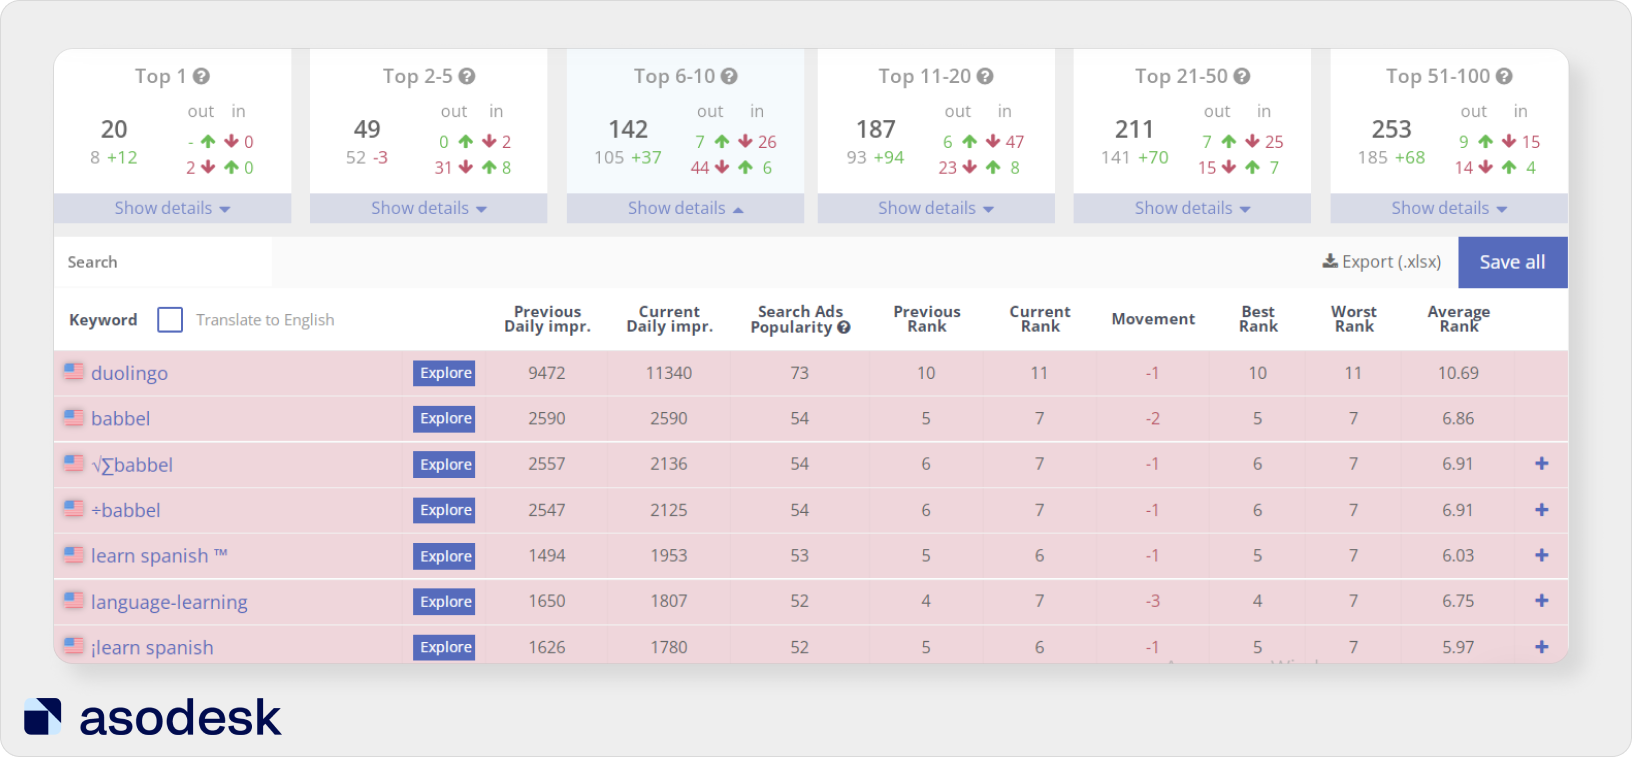
We need to study the change in positions thoroughly to find out by what number of queries the app position worsened or improved, as well as for which queries we appeared in search or dropped out.
2. Not analyzing app positions across different semantic cohorts
It is important to analyze the rise and fall of positions for queries from different semantic cohorts. Semantic cohort analytics help you understand how likely an app is to be in the top for the required keywords. By understanding how the app works for some keys, we can also predict how our positions might change for other keys in the same semantic cohort.
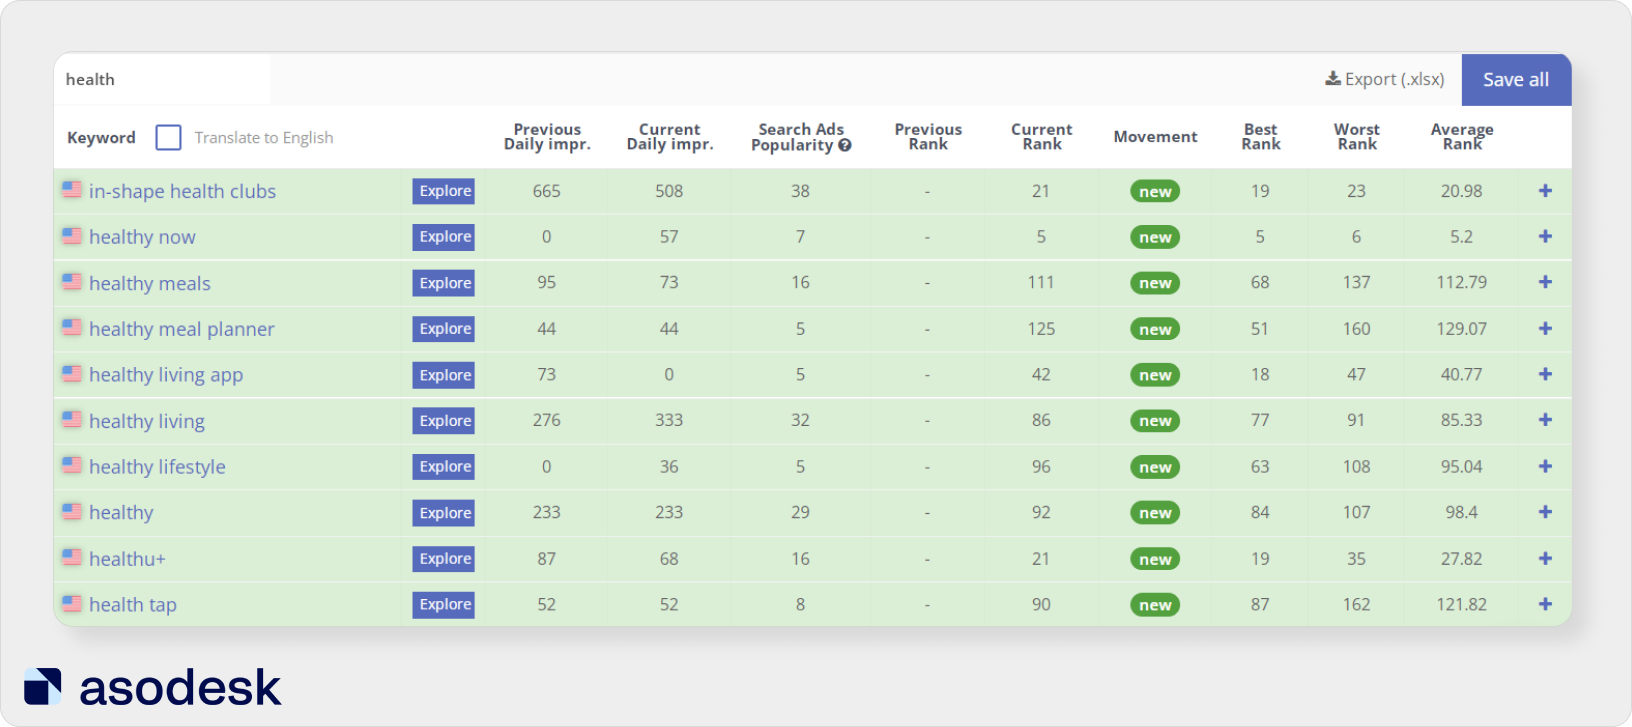
For example, the publishers of the Verv app completely changed the subtitle of the app. Now they position it as a health app, not a weight loss app.
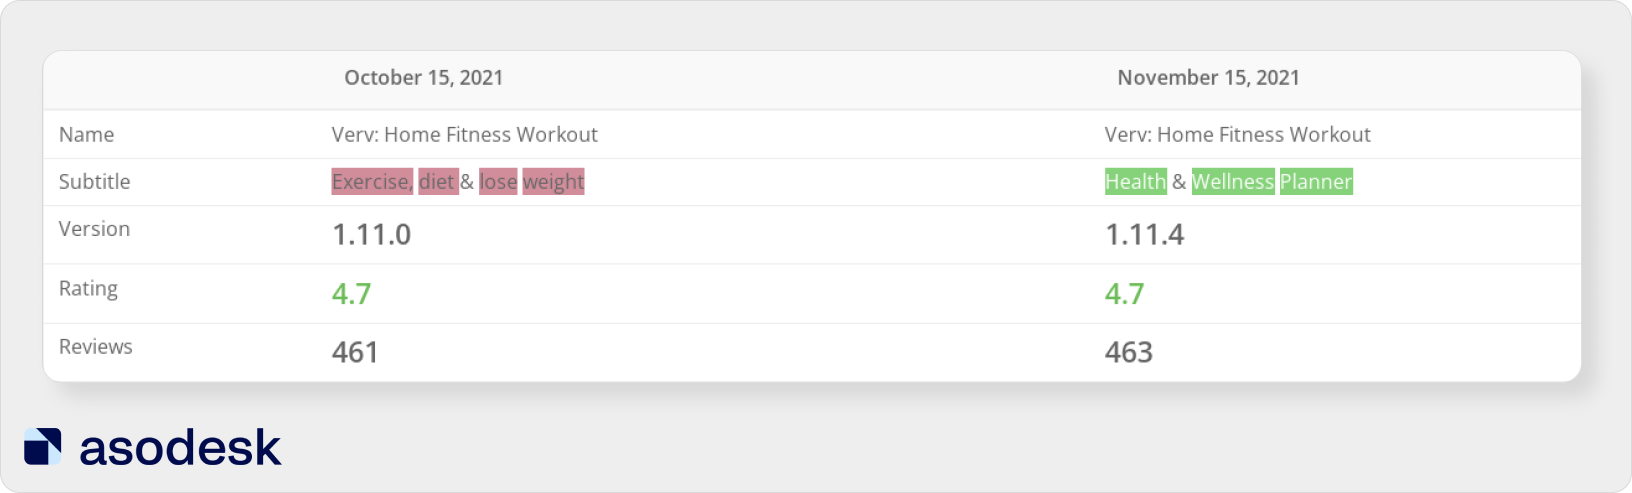
We can see that the app has appeared in search for many queries that contain the word “health”. This means that we are moving in the right direction.
Now the app has lost positions for many queries containing the word “diet”. But at the same time, positions continue to grow for some keywords from this semantic cohort. Perhaps this is because the app publishers have kept the word “diet” in the keywords field.
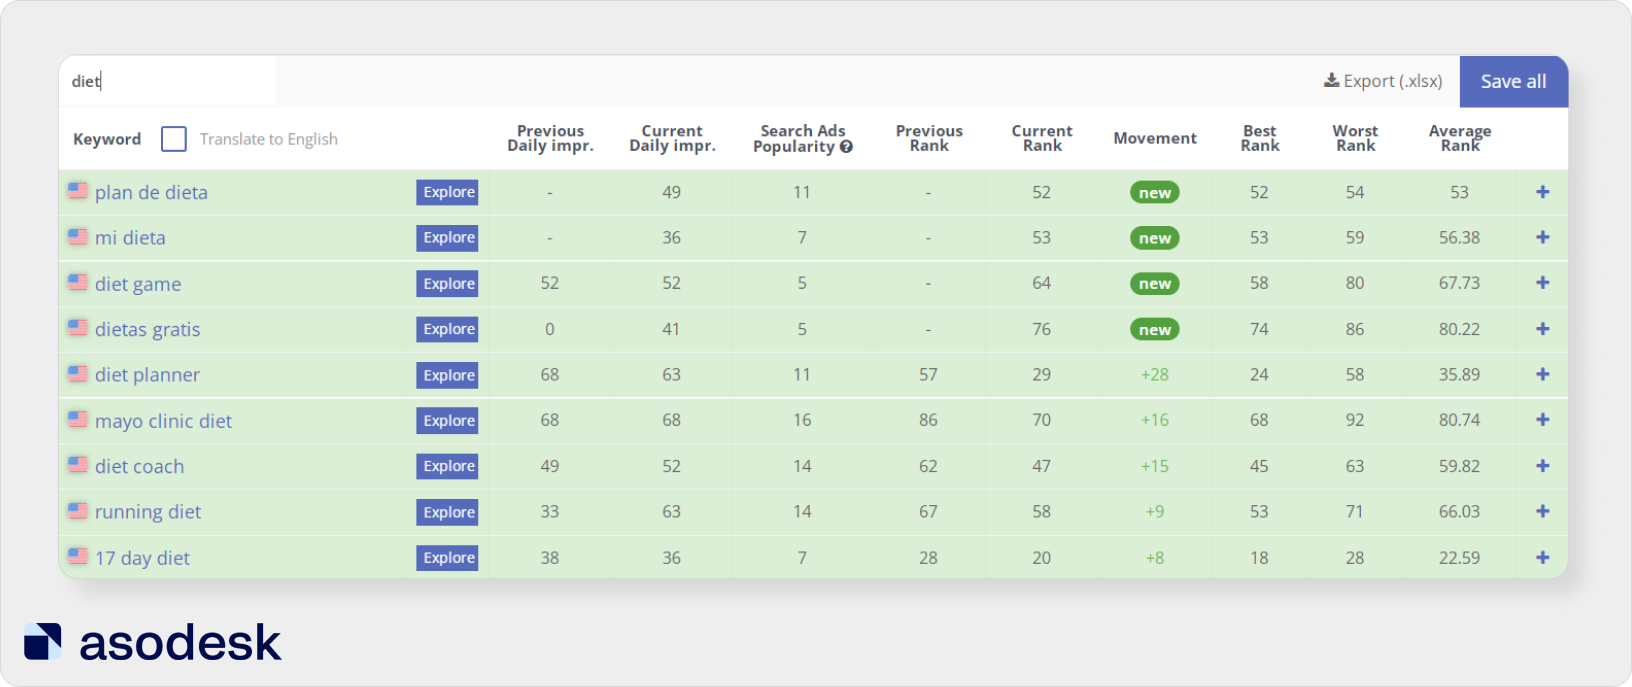
This analysis allows us to draw conclusions on whether we have chosen semantic cohorts for the app correctly. We can track this growth across different cohorts and decide on our next steps.
3. Not analyzing metrics in a complex
It is important not only to evaluate app visibility and conversion but also to see how these groups of metrics influence each other.
For example, the app position has grown for several queries. But, at the same time, we could lose positions for several important queries that used to bring us the majority of our traffic. Because of this, the number of installs may fall.
Below you can see an example of when the app position in search increases, but installs decrease.
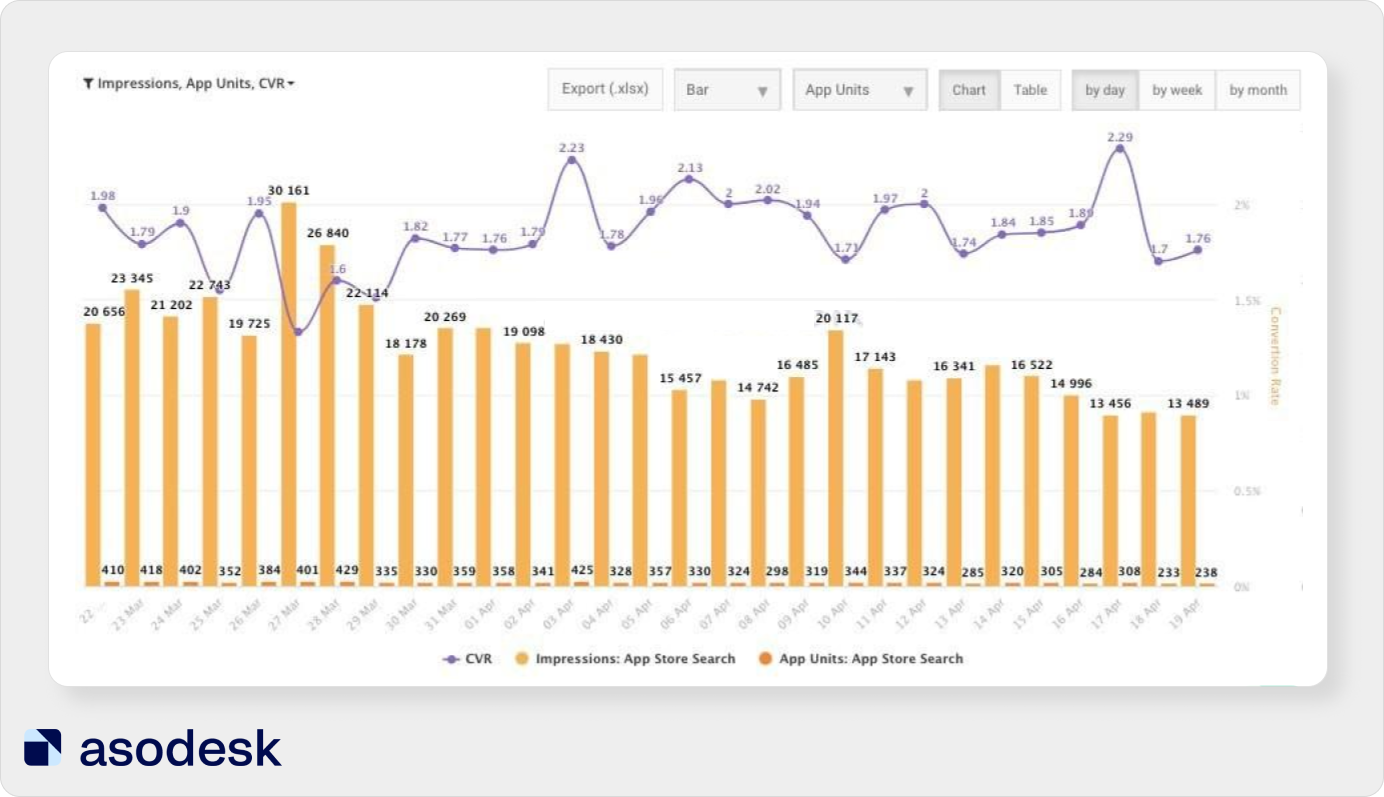
At the same time, conversion is growing, which means that the information on the app page meets user requests and motivates them to download the app.
In this case, it is important to thoroughly analyze all external metrics. It may be worth giving up the current keywords in the metadata and focusing on the semantic cohort that previously brought a significant portion of installs. You also need to think about how to keep the conversion at a high level.
What should be included in the ASO performance report
The standard ASO specialist report includes the following important micro-indicators:
- the number of queries for which the app is ranked, as well as the distribution of these queries by position ;
- keyword distribution with regard to <popularity — app position> ;
- place of the app in the top charts;
- app positions in categories;
- place in Featured;
- Impressions;
- Product Page Views;
- Installs and App Units;
- conversion rate (CVR).
We’ve also put together six important rules to keep in mind when writing a report:
1. Each metric should be assessed in conjunction with other indicators. For example, it is important to evaluate query popularity, app page views and installs together.
2. Include only the necessary app store optimization statistics. Think how each indicator in the report will be useful. If you cannot answer this question, it is better to remove the metric.
3. Remove redundant information from the report. For example: do not add daily indicators to the monthly report.
4. Make the report transparent. It is important that even a person with minimal knowledge of ASO can understand your report.
5. Visualize data and add charts & graphs. This will make it easier for readers to understand the reports.
6. Add conclusions and a plan for further work in each report. It is important not only to analyze current results but also to make a plan to achieve ASO KPIs for the future.
Subscribe to our newsletter to receive ASO news digests, as well as useful articles on ASO, mobile marketing, and working with reviews.